


Opening video editing software for the first time can feel like stepping into a cockpit: buttons everywhere, controls you don’t understand, and no clear flight plan. You’re ready to create, but instead you’re stuck clicking around, second-guessing every move. That hesitation often leads to sharing unpolished clips — or skipping video creation entirely.
The good news is that you don’t need years of film school or deep technical know-how to go from “I have footage” into “I have a polished video.”
This guide walks you through a complete, repeatable editing workflow built for trainers, instructional designers, marketers, and educators who want professional results without becoming full-time video editors.
What does video editing encompass, and why does it matter so much?
Video editing turns raw footage into something clear, focused, and useful for your audience. You take scattered clips, B-roll, screen recordings, and audio, and shape them into a story.
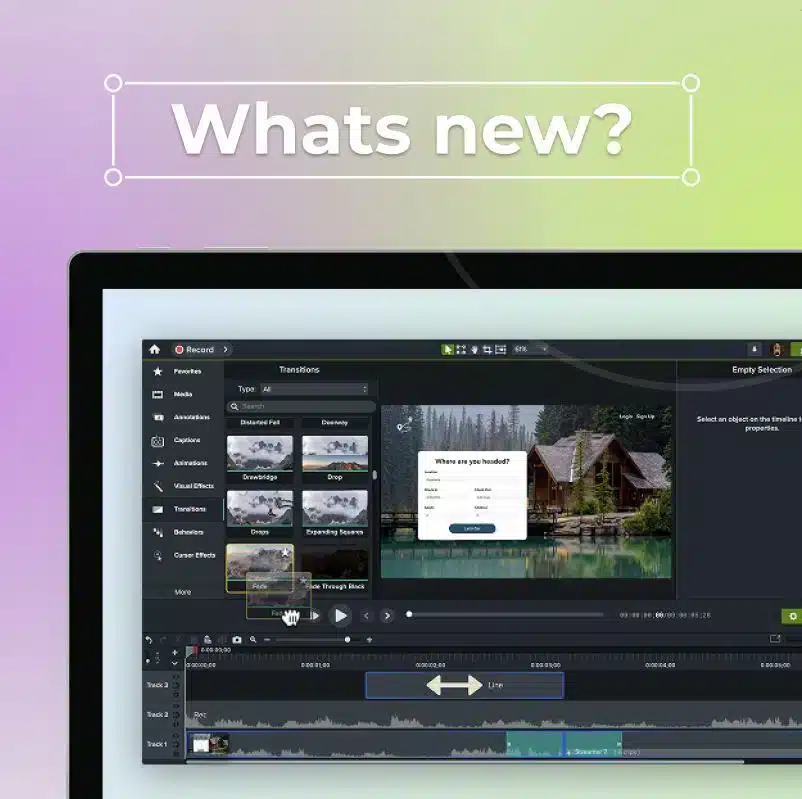
At its core, editing happens on a timeline. Drag-and-drop video clips, audio, and visuals, trim what you don’t need, add clean transitions, and layer in music or narration. When everything comes together, export the video in the right format for its destination.
Here are a few fundamental elements of video editing to get familiar with:
- Timeline: The workspace where you arrange clips chronologically
- Tracks: Separate layers for video, audio, text, and effects
- Transitions: Visual bridges between clips (cuts, fades, dissolves)
- Audio mixing: Balancing dialogue, music, and sound effects
- Export settings: Technical specifications for different platforms
When looking for editing tools, you’ll encounter three main types: mobile, browser-based, and desktop software. Each comes with its own advantages and limitations, and the type you choose depends on what kind of videos you plan to make.
| Tool Type | Best For | Examples |
| Mobile apps (for Android or iPhone) | Quick edits, social media content | iMovie, InShot |
| Browser-based | Collaboration without downloads | Camtasia Online, WeVideo, Clipchamp |
| Desktop software (for Mac and Windows) | Professional results, larger projects | Camtasia, Final Cut Pro |
For business and tutorial content, desktop tools typically offer the precision and feature depth professional communicators need. Browser-based tools work well for simple cuts and team collaboration, while mobile apps are ideal for quick edits for social media platforms.
Video editing matters because visual communication drives comprehension in ways that text alone can’t. Thoughtful, step-by-step editing guides viewers through complex information, highlights what’s most important, and removes confusion that can derail learning.
For a deeper dive into building a structured editing process, check out our video editing workflow guide.
How to set up your video editing workflow
A structured workflow prevents wasted hours searching for files, redoing edits, and sorting through version confusion. A few minutes of organization upfront pays off in every project that follows.
Storage and workspace preparation
Raw footage fills space fast, so dedicate at least 50GB of free storage per project. Create a main “Video Projects” folder on your primary drive with subfolders for each project to keep assets contained.
If you’re using browser-based tools, make sure your internet connection maintains at least 10 Mbps upload speed for smooth file transfers. Clear your browser cache regularly and close unnecessary tabs to avoid performance issues.
File naming and organization conventions
Consistent naming prevents confusion, especially when projects span weeks or involve multiple team members. A simple format works best:
ProjectName_Date_Version_Description
In practice, this format would look something like:
TrainingModule1_2025Aug07_v2_FinalEdit
To keep your naming conventions as consistent and organized as possible, keep these best practices in mind:
- Number clips in recording order (01_intro, 02_demo, 03_conclusion).
- Tag audio files by type (voiceover, music, effects).
- Save project files with matching names to video exports.
- Create template folders for recurring project types.
TechSmith tip: Tools like Snagit and Camtasia integrate naturally into your workflow — Snagit for quick screen captures and Camtasia for deeper editing. This pairing streamlines your process from capture to completion. For cloud-based sharing and feedback, Screencast keeps assets organized in team Collections, making it easier to centralize files and maintain version control.
Annotate and edit screenshots with Snagit
Professional mark-up tools and powerful features make it easy to create helpful images.
Try it Free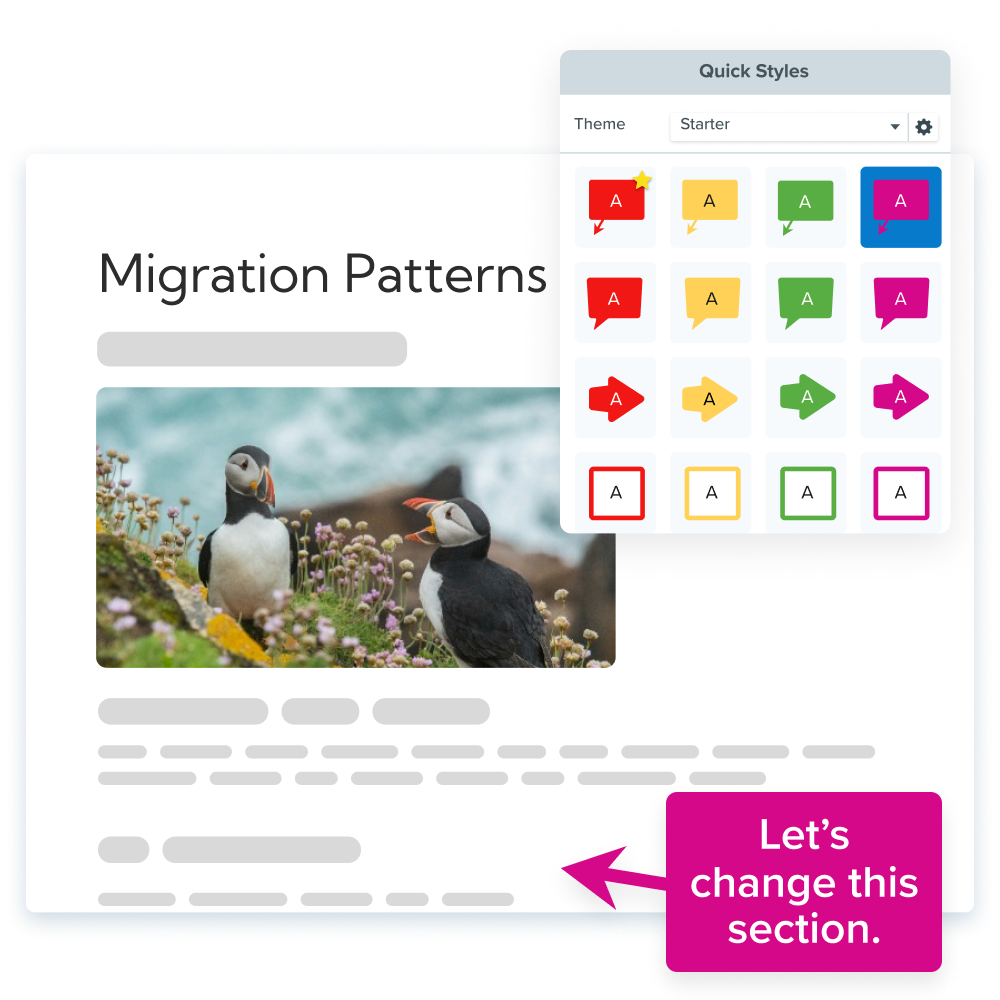
Step-by-step video editing process for beginners
Video editing follows a predictable sequence — like cooking from a recipe, but with fewer dirty dishes and a lot more undo buttons. Each step builds on the last, and skipping ahead usually means backtracking to fix problems.
1. Import and organize your clips
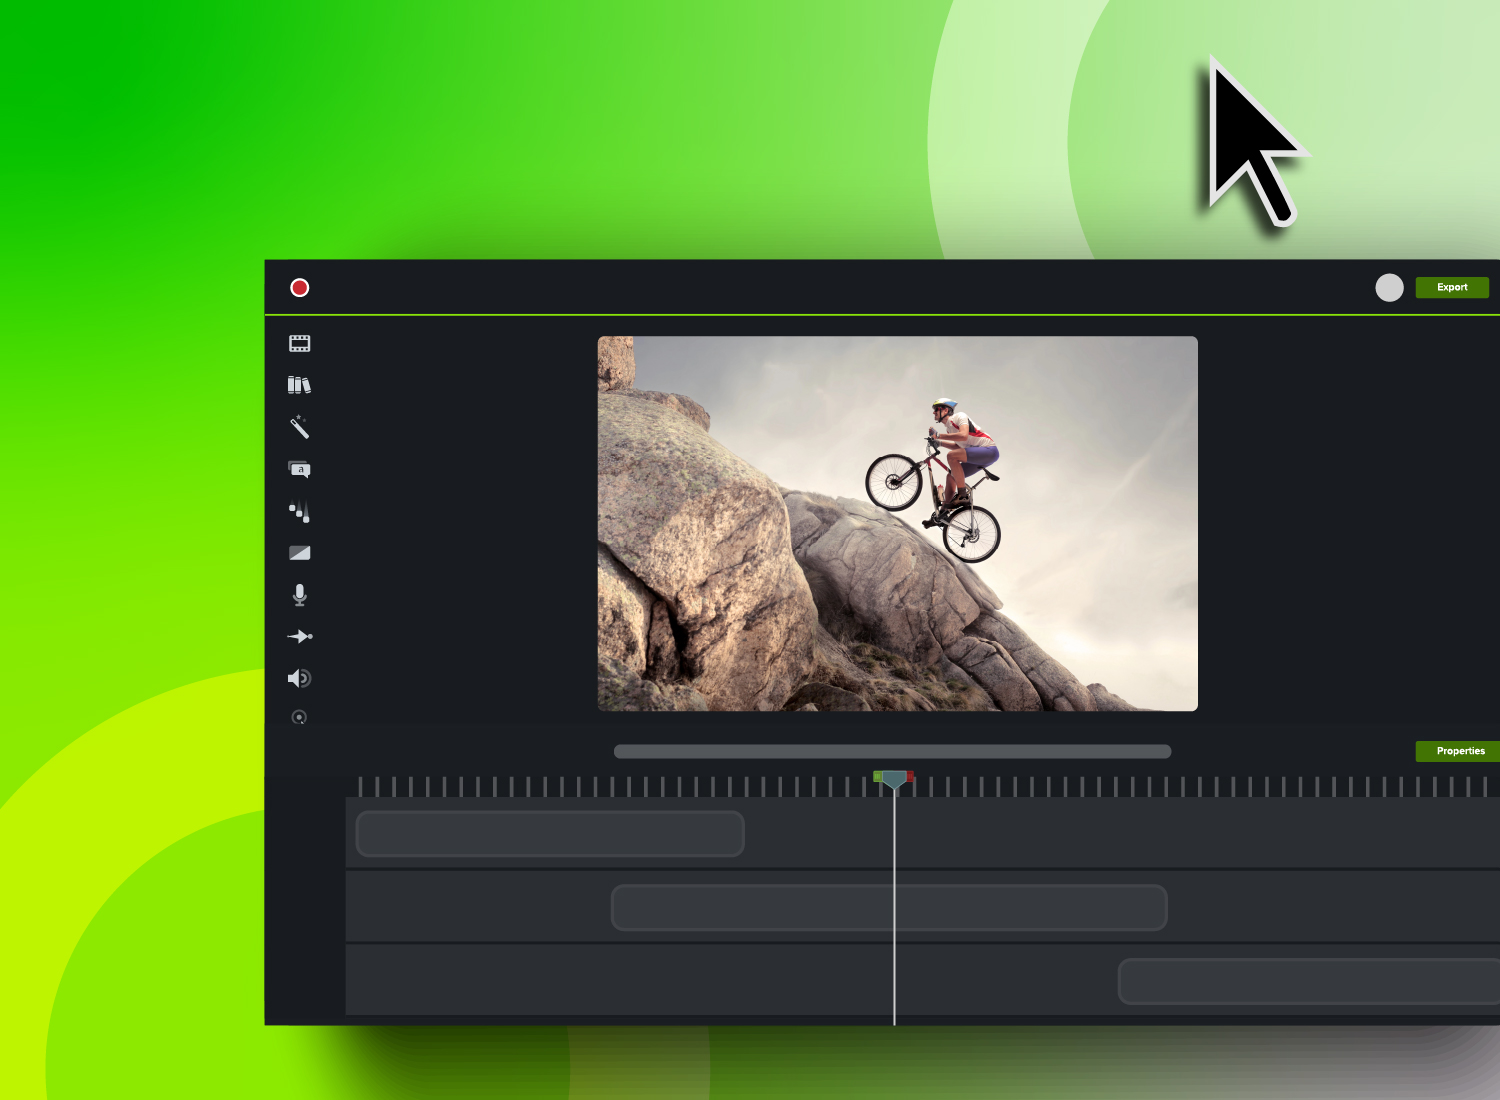
Start by importing all your footage into your editing software and setting up a clear structure. Taking time to organize now can save you from digging through cluttered timelines and overlooking important clips later.
Effective clip management means:
- Naming files descriptively before importing (like Interview_JohnSmith, Demo_LoginProcess).
- Grouping related clips into bins or folders.
- Deleting unusable footage right away.
- Color-coding clips by type (green for interviews, blue for screen recordings, etc.).
Camtasia tip: When you record your screen with Camtasia, the video and audio elements end up on different tracks. This makes it easy to swap out voiceovers or adjust audio levels without re-recording your video.
2. Trim footage and remove distractions
Good editing is clean storytelling. That means removing anything that doesn’t support your message. Raw footage always comes with a few false starts, long pauses, or “why did I say that?” tangents that dilute your main points.
Helpful trimming techniques include cutting rambling intros down to the essentials, removing filler words like “um” or “uh,” trimming dead air longer than 2–3 seconds, and cutting on action or speech for smoother transitions.
Camtasia + Audiate advantage: Audiate converts speech to text, so you can edit your video by deleting words from the transcript. The video timeline updates automatically, which saves time and keeps edits precise.
3. Add audio and music
Audio can make or break a video — viewers may click away after just a few seconds if sound is poor. A strong mix layers elements in this order:
- Primary dialogue or narration on the main audio track
- Background music on a secondary track at about 20–30% volume
- Sound effects on separate tracks for precise timing control
For best results, aim to keep dialogue between -12 and -6 dB, background music between -25 and -18 dB, and sound effects between -15 and -10 dB, depending on emphasis.
Camtasia advantage: Built-in audio cleanup tools reduce background noise, normalize volume across clips, and even remove filler words instantly. No manual edits required.
4. Use filters, transitions, and text
Enhancements should support your message, not compete with it. Keep effects purposeful and consistent across the project.
A good approach is to use simple cuts between most clips, reserve dissolves and fades for scene changes, and add text overlays for key points — limiting on-screen text to 3–5 seconds. Apply consistent color correction to unify your footage, and use at least 24pt text for mobile readability.
Camtasia library perks: Access customizable transitions, motion graphics, and text templates. Cursor effects (like highlighting, magnifying, and spotlighting) help direct attention in instructional content without overwhelming the viewer.
For more editing tips to improve your flow, check out these 50 strategies for creating better videos.
Advanced video editing techniques to elevate your content
These techniques take you beyond the basics, offering simple but powerful upgrades that even newer editors can use to solve common visual problems and add professional polish to finished videos.
If you’re still deciding which editing platform is right for you, explore these alternatives to Adobe Premiere Pro and CapCut for more options.
Adjust speed and stabilize shaky footage
Changing video speed can completely shift the pacing and feel of your content. Slowing footage to around 50% works well for emphasizing key moments or breaking down complex steps in detail. Speeding up a clip to 200–400% can condense long processes into short, easy-to-follow segments.
If your footage is shaky — especially handheld shots — stabilization tools can help smooth it out. These tools track frame-by-frame movement and apply subtle corrections to reduce distracting camera shake.
For best results:
- Apply speed changes to full actions or complete thoughts for the most natural results.
- Avoid adjusting speed mid-sentence in narrated clips, as this can distort the audio.
- Bump up the speed on screen recordings to 110–125% to tighten pacing and trim awkward pauses without losing clarity.
Apply basic color correction
Basic color correction adjustments help create a consistent look from start to finish. Without them, footage shot under varying lighting conditions or on different devices can feel disjointed and distract from your message.
Apply color correction before adding other effects or graphics. Start with brightness to set exposure, adjust shadows and highlights to balance contrast, and tweak saturation last, avoiding oversaturation that can look unnatural and pull focus from your content.
| Adjustment | Purpose | Effect |
| Brightness | Overall light level | Lighter or darker image |
| Shadows | Dark area detail | Reveals or deepens shadows |
| Highlights | Bright area detail | Controls overexposed areas |
| Saturation | Color intensity | More or less vivid colors |
Add motion graphics for visual emphasis
Motion graphics, like animated text, shapes, and icons, draw attention to important information and help guide viewers through your content. When used purposefully, they make videos more engaging and easier to follow.
Lower thirds are text overlays in the bottom third of the video frame, often used to identify speakers, add context, or emphasize key points. Standard lower thirds appear for 3–5 seconds and use consistent fonts, colors, and animation timing.
For professional content, simple animations work best:
- Text that slides in from the left
- Elements that fade in from transparent
- Graphics that scale smoothly from small to full size
Camtasia advantage: Built-in cursor smoothing eliminates jerky mouse movements in screen recordings. Highlighting tools draw attention to key areas, while magnification zooms in to give viewers a closer look.
Go from screen recording to polished video
A screen recording is just the start. Camtasia’s editor helps you add the callouts, animations, and edits you need to create a truly professional video.
Free Download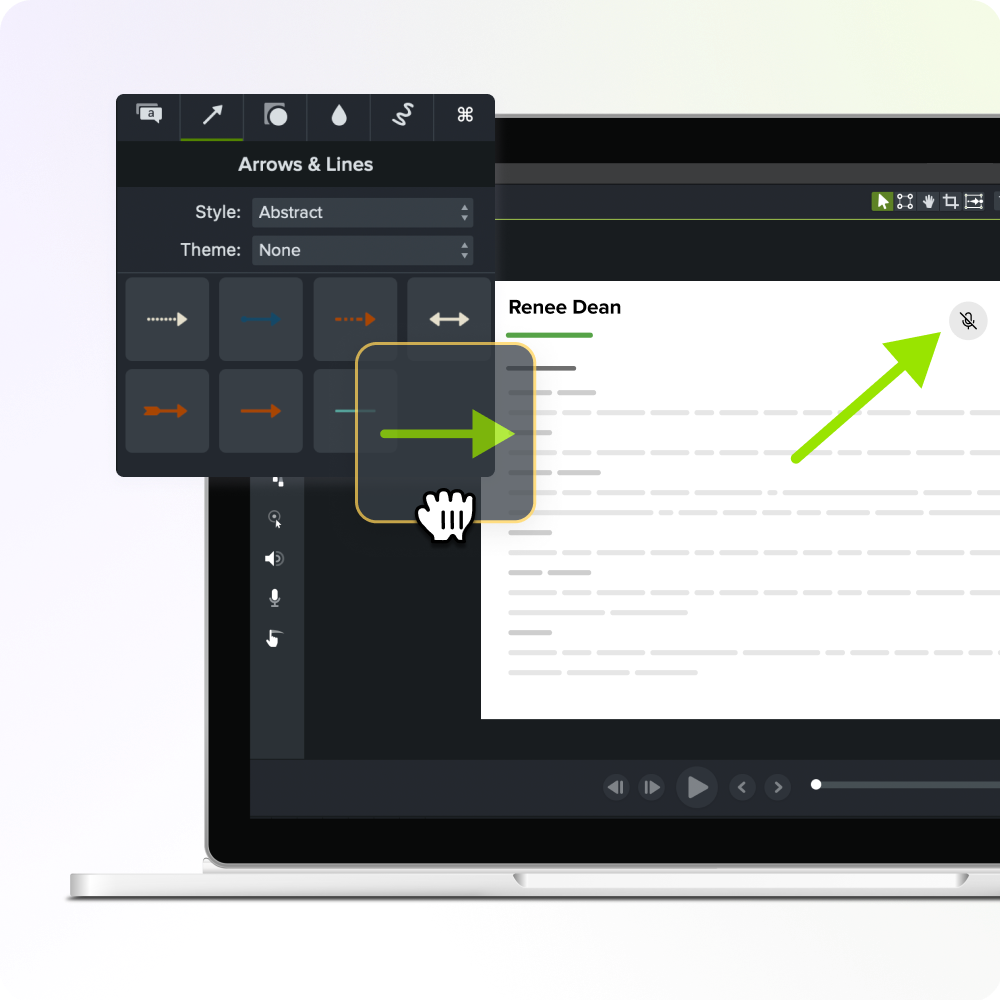
How to collaborate on video editing projects
Successful video editing collaboration relies on clear systems for file sharing, feedback, and version control. Without them, projects can get bogged down in miscommunication and duplicated work, especially for remote teams or on different software platforms.
File sharing strategies:
- Use cloud storage services like Google Drive or Dropbox for files up to 5GB.
- Follow a consistent naming format such as ProjectName_Version_Date_Editor.
- Export preview versions at 720p to keep review files small for faster transfer.
Time-coded feedback systems:
- Include timestamps to pinpoint exact edits (“2:34 – Remove this pause”).
- Use a standardized feedback format (like Timestamp – Issue – Suggested solution).
- Store feedback in shared spreadsheets instead of scattered email threads.
Version control protocols:
- Label versions clearly, like v1 (rough cut), v2 (revised), v3 (polish), v4_FINAL.
- Assign specific roles for each stage, like primary editor, project manager, and approver.
- Move outdated files to an “Archive” folder to avoid confusion.
TechSmith tip: Screencast offers collaboration features built for video review. Upload your files, collect time-stamped comments directly on the timeline, and organize projects into Collections for easy version tracking and passphrase-protected sharing.
Looking for professional screen recording software?
From simple screen captures to polished video editing, TechSmith has everything you need to create professional-quality content.
Learn More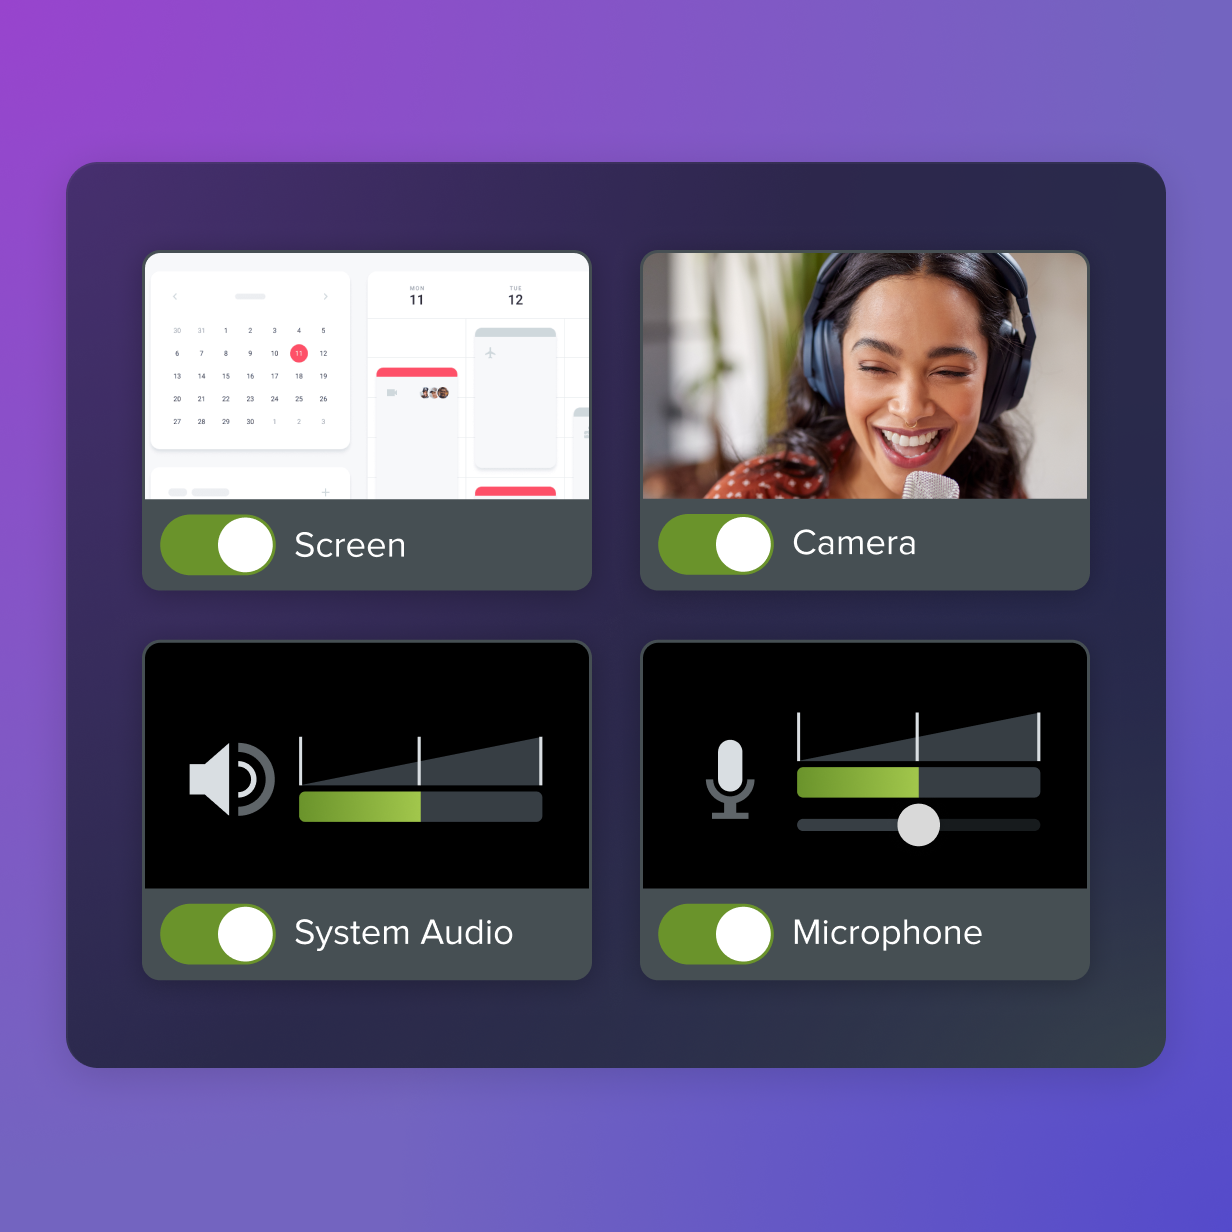
Tips to streamline your workflow from import to export
Efficient workflows prevent the frustration that leads many creators to abandon video projects halfway through production. By systematizing file management, export settings, and distribution, you create predictable processes that work no matter how complex the project gets.
Organize metadata and file versions
Metadata stores important details about your video files beyond the content itself, such as creation dates, project name, version numbers, and descriptive tags. Having this information in place makes it easier to locate files, even months later.
As mentioned above, keep things consistent and searchable by following a standard naming structure that communicates the project, creation date, version number, and any recent changes.
Apply metadata tags in your editing software to categorize by topic, department, or audience. For example, “HR-Training,” “Product-Demo,” or “Client-Presentation.”
These simple habits can save hours when revisiting older video projects or repurposing content.
Choose the right export settings for each platform
Platform specifications determine how videos appear to viewers, affecting both visual quality and upload success. The wrong settings can result in pixelated footage, failed uploads, or videos that look poor on mobile devices.
Here are our recommended export specifications for popular platforms:
| Platform | Resolution | Frame Rate | File Format |
| YouTube | 1920×1080 | 30fps | MP4 (H.264) |
| 1920×1080 | 30fps | MP4 (H.264) | |
| TikTok | 1080×1920 | 30fps | MP4 (H.264) |
| 1080×1080 | 30fps | MP4 (H.264) |
Frame rate consistency matters more than higher frame rates for most business content. Export at 30fps for standard content, and use 60fps only if the original footage was recorded at that rate. Mismatched frame rates can cause stuttering playback that distracts viewers.
Audio specs are generally consistent across platforms: 44.1kHz sample rate, 128–192kbps bitrate, and stereo channels. For web distribution, the AAC audio codec offers the best balance of compression and compatibility.
If you can edit a doc, you can edit a video
Stop fearing the timeline. Camtasia Audiate transcribes your recording so you can edit your video just by editing the text.
Free Download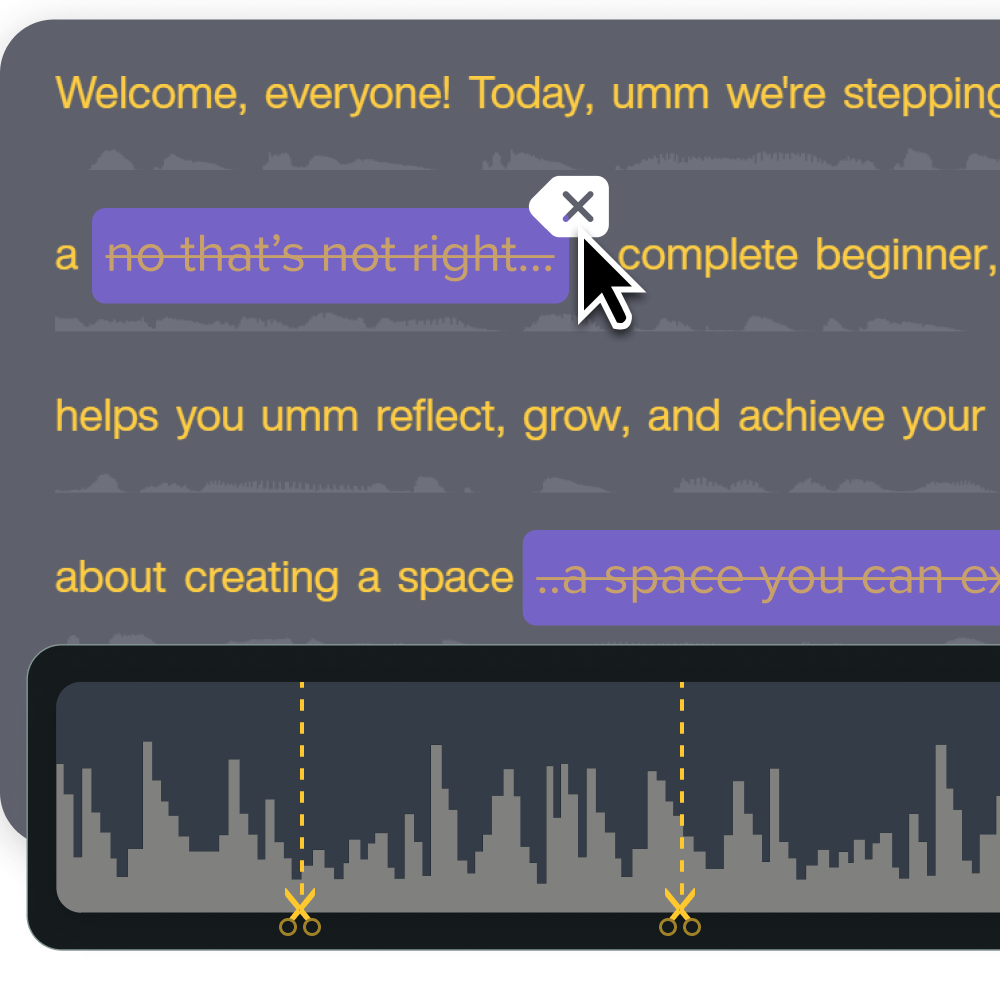
Distribute your videos across platforms
Sharing your content across multiple platforms helps maximize reach, but it works best with a plan. Otherwise, upload schedules can quickly become overwhelming. Batch processing and scheduling tools make distribution faster and more manageable.
If your editing software supports batch rendering, export multiple formats at once. Start with a master high-quality version for archiving, then create platform-specific versions optimized for each channel. Automated batch exports can save hours of manual work.
Scheduling features also help you time uploads for different audiences. Post during off-peak hours to reduce processing delays, then schedule publication for the days and times your viewers are most active.
How to use AI tools to save time and boost quality
Artificial intelligence (AI) can handle repetitive editing tasks that normally take hours, freeing you to focus on storytelling and content strategy.
Think of AI as an assistant that automates technical processes — not as a replacement for your creative expertise!
Modern video editing software often includes AI video features that solve common production bottlenecks:
- Scene detection to identify cuts between different shots
- Noise cleanup to remove background hum or microphone interference
- Background removal to separate subjects from their environments
- Auto-captioning to generate subtitle tracks directly from speech
Camtasia + Audiate advantage: These tools integrate AI into your workflow without taking the creativity out of your hands. You can generate voiceovers from scripts using natural-sounding AI voices in multiple languages, making it easy to localize content for global teams. Need to translate existing narration? AI can handle that, too — no re-recording required.
You’re still in charge of the creative decisions: defining learning goals, organizing your message, and choosing visuals that resonate. AI simply speeds up the technical work so you can test ideas faster and spend more time refining what matters.
Start to build confidence and edit faster with TechSmith
Video editing gets easier with practice, turning once-overwhelming tasks into muscle memory. You’ll move through timelines with shortcuts and know exactly which techniques make your content shine. The workflow in this guide speeds production by keeping files organized, simplifying exports, and using AI for technical tasks.
TechSmith unites every step of that workflow in one connected toolkit. Capture ideas and screen content with Snagit, edit and polish in Camtasia with AI-assisted audio cleanup and motion graphics, then share and collect feedback in Screencast. By integrating capture, editing, and distribution, TechSmith removes friction — helping you go from raw footage to finished videos faster, with quality that matches your vision.
Ready to turn raw footage into professional video content? Check out all of TechSmith’s editing products today.
Frequently Asked Questions
Camtasia offers an intuitive interface with powerful features that won’t overwhelm new editors. It includes screen recording, basic video editing tools, and effects designed for instructional and business videos.
Plan for one to two hours of editing time per finished minute of video. A 5-minute video typically takes 5–10 hours to edit, depending on its complexity and your familiarity with the software.
Yes. You can edit professional-looking videos with a standard computer and the right software. Most modern laptops handle basic video editing, though having more RAM (16GB+) and extra storage space will improve performance.
Video production covers the entire creation process, from planning and filming to editing. Video editing is the post-production phase where raw footage is arranged, trimmed, and enhanced.
Share